Metrics for GVCS Deployment: Difference between revisions
Jump to navigation
Jump to search
| (15 intermediate revisions by the same user not shown) | |||
| Line 1: | Line 1: | ||
= | =Dashboard Level Metrics= | ||
These are metrics to inform contributors about clear and visible progress. | |||
*Number of modules and machines completed | |||
*Number of active wiki contributors | |||
=Website= | |||
*Uptime percentage | |||
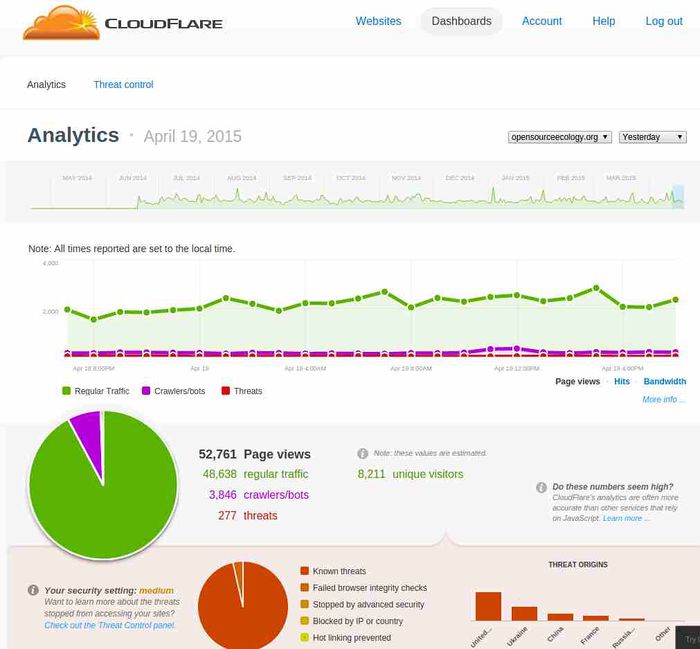
*Cloudflare, April 19 - 1 Day - Opensourceecology.org. Even hourly is shown below over a 24 hour period - 8000 unique visitors - traffic means OSE audience is spread pretty much evenly around the globe. | |||
[[Image:cloudflare041915.jpg|700px]] | |||
=Wiki= | |||
*Edits | |||
*Top contributors | |||
*Commits | |||
=Core= | =Core= | ||
| Line 10: | Line 23: | ||
**Specific metric: number of views on OSE explainer videos | **Specific metric: number of views on OSE explainer videos | ||
*The rate of prototyping of GVCS machines | *The rate of prototyping of GVCS machines | ||
*Number of products that corporations fund to make them open source | |||
*Size of permanent staff and volunteers on site(24) | |||
==Primary - Transformation== | ==Primary - Scaling and Transformation== | ||
*Number of OSE Incubators formed worlwide | *Number of OSE Incubators formed worlwide | ||
*Number of OSE Chapters started worldwide. Chapters assist in development | *Number of OSE Chapters started worldwide. Chapters assist in development | ||
| Line 22: | Line 37: | ||
**Implementation: needs chapter standards and OSE Global Chapters Manager | **Implementation: needs chapter standards and OSE Global Chapters Manager | ||
*Total sales volume of GVCS Machines ($45k) | *Total sales volume of GVCS Machines ($45k) | ||
*Number of technical contributions to the project worldwide | *Number of technical contributions to the project worldwide | ||
**Could be measured by number of wiki edits or hits | **Could be measured by number of wiki edits or hits | ||
| Line 34: | Line 48: | ||
**We need to start graphing these numbers by category - such as engineers, documenters, video producers, etc. | **We need to start graphing these numbers by category - such as engineers, documenters, video producers, etc. | ||
*Number of wiki contributors and number of total edits | *Number of wiki contributors and number of total edits | ||
*Number of Facebook, Twitter followers, and number of hits on wiki, blog, TED Talk, and website. | |||
== | ==Dogfooding Metrics== | ||
*Pilot projects with use cases | *Pilot projects with use cases | ||
**Feedback sought: effectiveness of local production; we do not provide machines | **Feedback sought: effectiveness of local production; we do not provide machines | ||
| Line 46: | Line 61: | ||
*money spent per Distributive Enterprise | *money spent per Distributive Enterprise | ||
*Earnings, Donations, Grants | *Earnings, Donations, Grants | ||
* | *Local Food produced on site | ||
*Local Energy Produced On Site - kW-Hr/month | *Local Energy Produced On Site - kW-Hr/month | ||
Latest revision as of 01:07, 30 December 2015
Dashboard Level Metrics
These are metrics to inform contributors about clear and visible progress.
- Number of modules and machines completed
- Number of active wiki contributors
Website
- Uptime percentage
- Cloudflare, April 19 - 1 Day - Opensourceecology.org. Even hourly is shown below over a 24 hour period - 8000 unique visitors - traffic means OSE audience is spread pretty much evenly around the globe.
Wiki
- Edits
- Top contributors
- Commits
Core
Primary - Development Metrics
- Number of Prototypes Built (24), Number of Unique Prototypes Built (15), Beta Releases (4), and Full Product Releases (0)
- Cost to performance of Full Product Releases compared to industry standards. Typical goal: 5x cost reduction or better.
- The number of projects documented to full Open Source Hardware Taxonomy Standards
- Possible measurement: the number of taxonomy items completed from the list of ~100 or so
- The quantity of high quality explainer videos
- Specific metric: number of views on OSE explainer videos
- The rate of prototyping of GVCS machines
- Number of products that corporations fund to make them open source
- Size of permanent staff and volunteers on site(24)
Primary - Scaling and Transformation
- Number of OSE Incubators formed worlwide
- Number of OSE Chapters started worldwide. Chapters assist in development
- The number of OSE-based Microfactories started around the world
Primary - Economic Metrics
- Number of machines replicated independently around the world (8)
- The number of OSE chapters started worldwide
- Implementation: needs chapter standards and OSE Global Chapters Manager
- Total sales volume of GVCS Machines ($45k)
- Number of technical contributions to the project worldwide
- Could be measured by number of wiki edits or hits
- Number of independent enterprises spawned based on the GVCS tools
Community Metrics
- The number of design events held monthly
- Funding level ($450k for next 10 months, graph of overall funding)
- Technical Blog Posts (prototype builds)
- Technical Team (Tech Team Culturing Survey) member numbers
- We need to start graphing these numbers by category - such as engineers, documenters, video producers, etc.
- Number of wiki contributors and number of total edits
- Number of Facebook, Twitter followers, and number of hits on wiki, blog, TED Talk, and website.
Dogfooding Metrics
- Pilot projects with use cases
- Feedback sought: effectiveness of local production; we do not provide machines
- Publicity and Honors attained
- Number of wiki edits by top 10 contributors
- TF numbers
- Twitter, FB followers
- YouTube subscribers, views
- money spent per prototype built
- money spent per Distributive Enterprise
- Earnings, Donations, Grants
- Local Food produced on site
- Local Energy Produced On Site - kW-Hr/month
