Franchise Growth: Difference between revisions
Jump to navigation
Jump to search
(→Growth) |
(→Growth) |
||
| Line 5: | Line 5: | ||
*102 by 1959 | *102 by 1959 | ||
*1000 by 1968 - 10 years to reach 1000 | *1000 by 1968 - 10 years to reach 1000 | ||
*10000 by 1988 | *10000 by 1988 - 30 years to 10,000 | ||
*8 more years to double that to 20000 by 1996 | *8 more years to double that to 20000 by 1996 | ||
*2000 per year in 1997 | *2000 per year in 1997 | ||
Revision as of 20:19, 29 June 2020
Growth
The growth rate of McDonalds summary:
- First in 1955
- 34 by 1958
- 102 by 1959
- 1000 by 1968 - 10 years to reach 1000
- 10000 by 1988 - 30 years to 10,000
- 8 more years to double that to 20000 by 1996
- 2000 per year in 1997
More
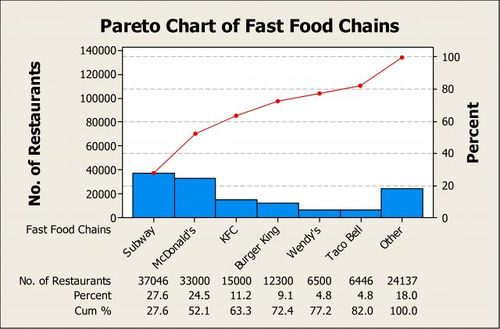
Number of fast food chains - about 30k+ of MacDonalds and Subways, each. Red line is total. Pareto = 80/20 rule - not the last column, all others - are 20%.
http://blog.minitab.com/blog/michelle-paret/fast-food-and-identifying-the-vital-few
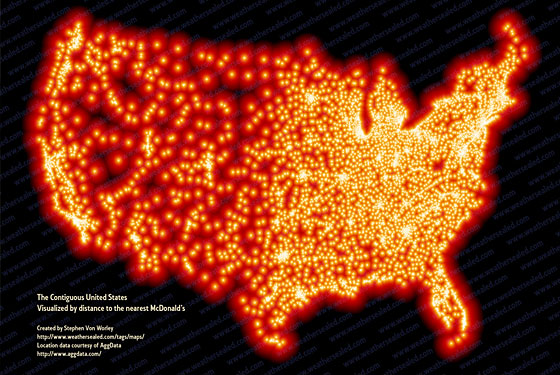
Visually speaking [1]:
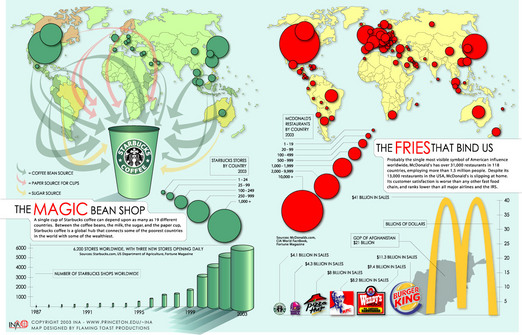
Number of McDonalds and Starbucks by country - [2]


