GDP Per Capita: Difference between revisions
Jump to navigation
Jump to search
| Line 1: | Line 1: | ||
=Statistics= | =Definitions and Statistics= | ||
*US is around $63k [https://en.wikipedia.org/wiki/List_of_countries_by_GDP_(nominal)_per_capita] | *US is around $63k [https://en.wikipedia.org/wiki/List_of_countries_by_GDP_(nominal)_per_capita] | ||
*Note that wages are just a part of Per Capita Income - for the US it is about $30k/person | *Note that wages are just a part of Per Capita Income - for the US it is about $30k/person | ||
*Gross National Income - is GDP + factor incomes [https://en.wikipedia.org/wiki/Gross_national_income] | |||
=Empoyment as function of GDP= | =Empoyment as function of GDP= | ||
Latest revision as of 16:37, 9 March 2021
Definitions and Statistics
- US is around $63k [1]
- Note that wages are just a part of Per Capita Income - for the US it is about $30k/person
- Gross National Income - is GDP + factor incomes [2]
Empoyment as function of GDP
- Per capita income is national income divided by population [3]
- National income is GDP + salary + rent + profit. [4]
- Per capita income is thus >> salary.
- Average us salary is $31k. [5]
- Lower, mid, upper income - per person is about <30 for lower, >80 for upper.
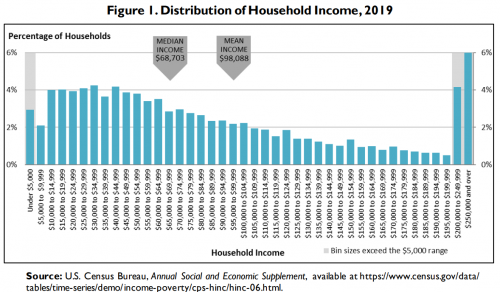
- Average houshold (2.2) is 68k - so this checks out with average income.
- Distribution - shocking that 10% are above 200k! That's a lot of wealth at the top, skewing median to a much higher mean.
 - 2019, source [6]
- Maysville, Missouri, statistics - [7]