COVID Peak: Difference between revisions
Jump to navigation
Jump to search
| Line 13: | Line 13: | ||
=Explanation of the Above and Summary= | =Explanation of the Above and Summary= | ||
*See report - [https://www.imperial.ac.uk/media/imperial-college/medicine/sph/ide/gida-fellowships/Imperial-College-COVID19-NPI-modelling-16-03-2020.pdf] | *See report - [https://www.imperial.ac.uk/media/imperial-college/medicine/sph/ide/gida-fellowships/Imperial-College-COVID19-NPI-modelling-16-03-2020.pdf] | ||
* | *Peak deaths occur about 1 month after peak cases. Peak cases for the USA are slated for May 20 (2 months), and peak deaths for June 20. | ||
*Some later states in US have peak cases around June 20 - 1 month later than earlier states. | |||
=As of March 22, 2020= | =As of March 22, 2020= | ||
Revision as of 18:27, 22 March 2020
Timelines
- https://www.businessinsider.com/coronavirus-pandemic-timeline-history-major-events-2020-3
- https://coronavirus.jhu.edu/map.html
Model Curves
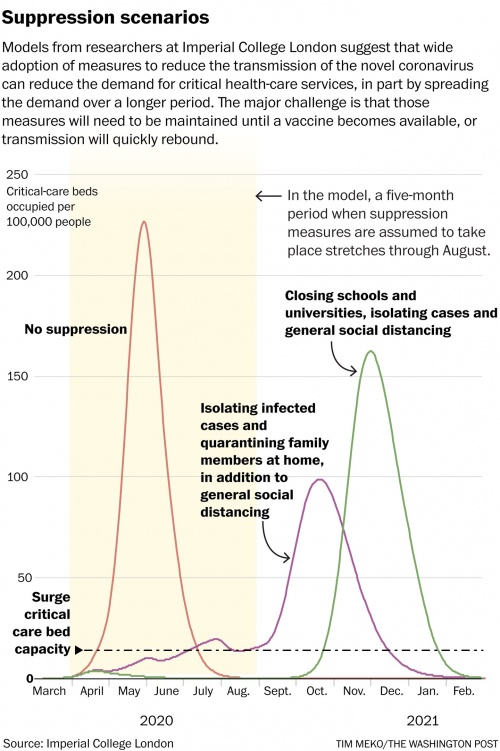
- This is fascinating - extreme lockdown results in severe cases popping up. The second half of graph shows the results when the lockdown is lifted by September (after 5 months): hell will break loose again. This graph shows a warning on the 12+ month duration that is required until a vaccine is developed.
https://www.washingtonpost.com/health/2020/03/19/coronavirus-projections-us/
Explanation of the Above and Summary
- See report - [1]
- Peak deaths occur about 1 month after peak cases. Peak cases for the USA are slated for May 20 (2 months), and peak deaths for June 20.
- Some later states in US have peak cases around June 20 - 1 month later than earlier states.
