Solar Collector Calculations: Difference between revisions
Jump to navigation
Jump to search
No edit summary |
|||
| Line 22: | Line 22: | ||
[[Image:edge losses.jpg]] | [[Image:edge losses.jpg]] | ||
=Vapor Generation Rate= | |||
Based on water, we have: | |||
[[Image:phases of water.gif]] | |||
Revision as of 14:05, 28 June 2008
Losses due to edge effects and lack of daily tracking
If we use a passive tracking arrangement for the collector, with only seasonal adjustment, then we have two losses:
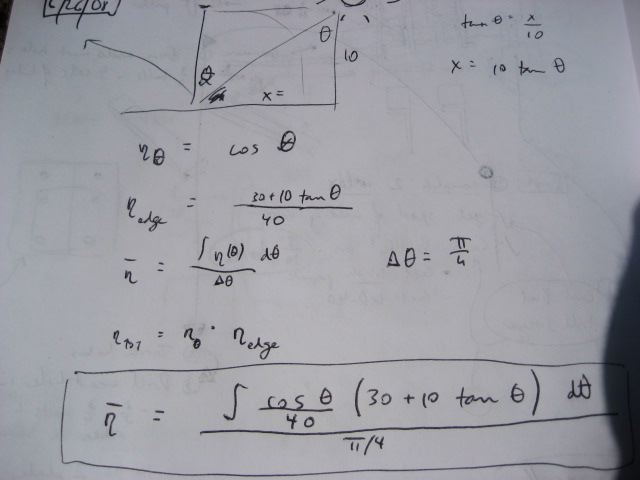
- Loss due to the sun not being perpendicular to the array - if theta is the angle measured from the position of the sun at high noon - then the efficiency stemming from this varies as cosine(theta)
- Loss due to edge effects - when the sun is not directly overhead, part of the collector tube is not illuminated (assuming length of collector tube is the same as the length of the reflectors)
The overall average efficiency (eta bar) considering these two losses - for the 6 hours of the day around high noon - is:
This value - I estimate to be around 75% - for the average efficiency of the collector without daily tracking.
Someone please run this on the computer or analytically and fill in the exact value.
Losses due to edge effects only
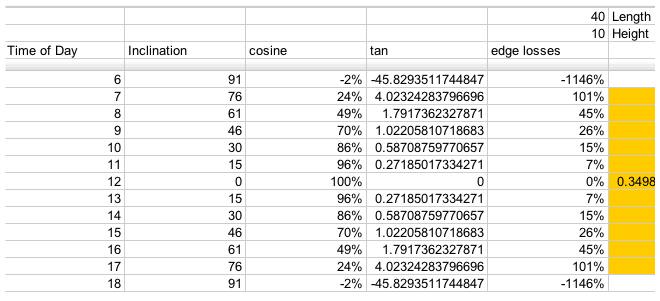
For a 40x10 foot solar collector array, with length running East to West, this is a table of losses corresponding to the edge efficiencies (Greek eta_edge) represented by the
term in the above equations:
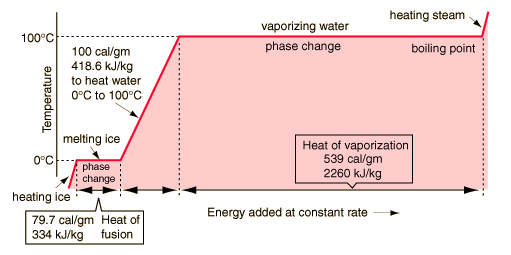
Vapor Generation Rate
Based on water, we have:


