COVID Peak
Jump to navigation
Jump to search
Timelines
- https://www.businessinsider.com/coronavirus-pandemic-timeline-history-major-events-2020-3
- https://coronavirus.jhu.edu/map.html
Model Curves
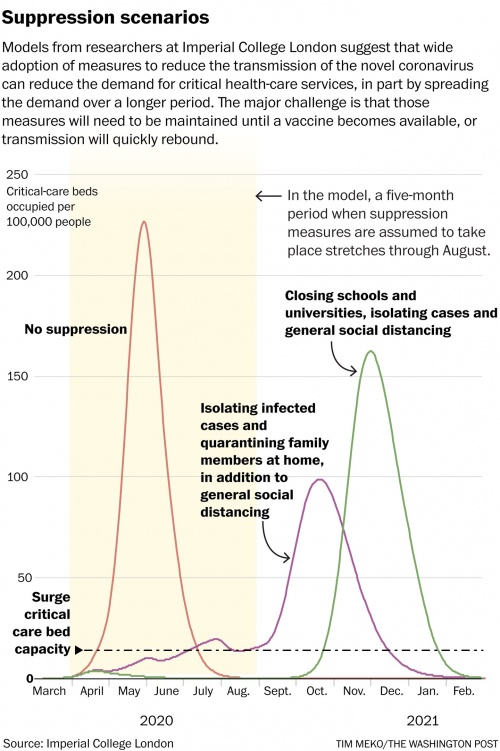
- This is fascinating - extreme lockdown results in severe cases popping up. The second half of graph shows the results when the lockdown is lifted by September (after 5 months): hell will break loose again. This graph shows a warning on the 12+ month duration that is required until a vaccine is developed.
https://www.washingtonpost.com/health/2020/03/19/coronavirus-projections-us/
