Functional Block Diagrams
A complex system is too hard to design as a whole. By breaking it down into smaller components, you reach a level that can be designed in practice. Functional Block Diagrams are a way to display the component parts of a system from a functional perspective. In other words, what does it do? It also shows the flows among the parts of the system with each other, and also with the external environment. In other words, how does it interact? Flows can contain any sort of item, including information, matter, energy, labor, etc, or a combination thereof.
Functional Block Diagrams have been standardized as an engineering document in the same way as construction blueprints or electronic circuit diagrams. This aids understanding if everyone is using the same layout and symbols. (Insert References to standards docs here)
The diagrams are a tool within the Systems Engineering process. This page will describe how to build and read "Functional Block Diagrams" and OSE wiki pages displaying them.
Page Organization
A system that is too complex to design as a whole is also too complex to display as a whole on a single diagram. Therefore the block diagrams are broken up into multiple pages for the purpose of manageable display, but the system is still a single interconnected whole. Flows, function boxes, and pages are given unique numbers so that people can trace from one page to the next. A box or arrow at one level becomes enlarged into a page at the lower, more detailed level and keeps the identical number. Notes are added as needed to describe the functions and flows. Diagrams should fit on a single page each. Notes which overflow the diagram page go on additional pages labeled with the same number + a following A,B,C,...
- Each page should show the diagram image and any added notes images if more space is needed
- Space after can hold links to higher and lower level diagrams, comments and discussion, links to designs that implement the functions, external links, etc.
- Please use the following category "Functional Block Diagrams"
Example Diagram
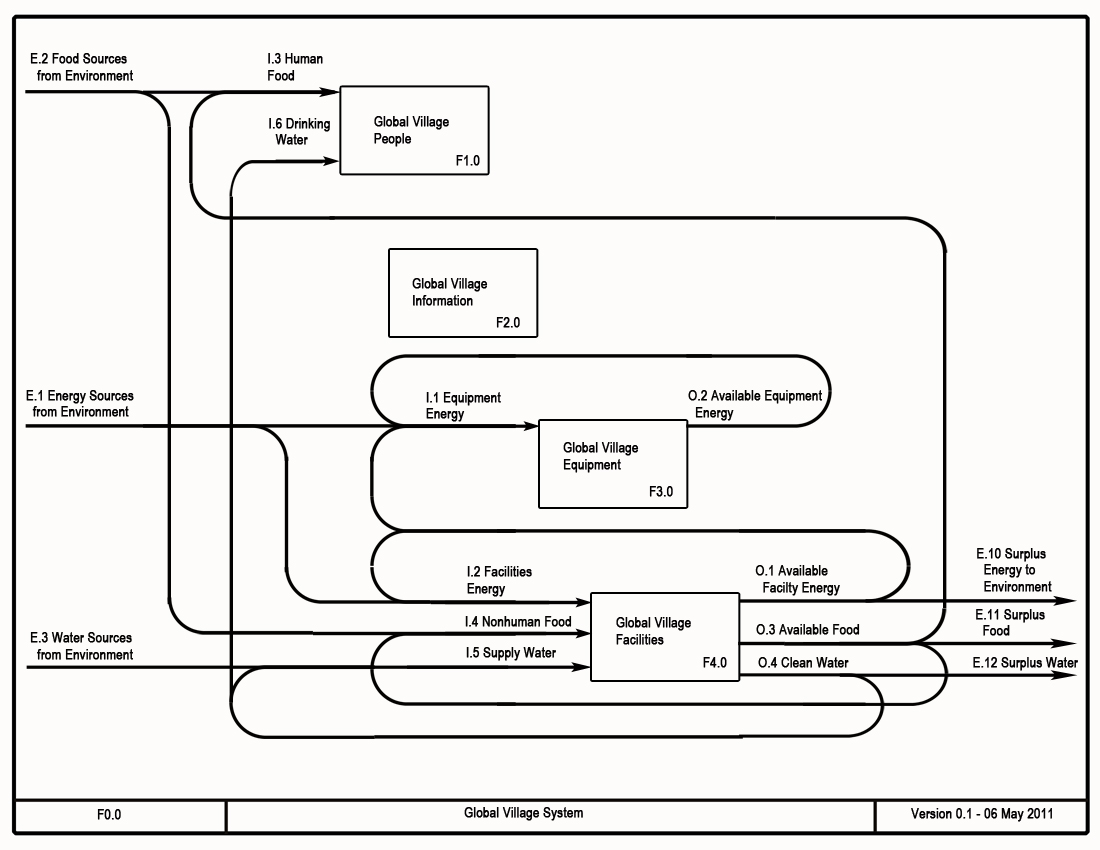
Here is an example of a top level block diagram, showing the Global Village system as four boxes. The flows from the environment enter on the left and leave on the right. Environment is meant in the technical sense of "the rest of the world outside the system". Inputs and outputs to a given box also enter from the left and leave on the right. Flows split into more detailed parts, or merge to a total flow, always in the direction of the arrows.
NOTE: more details to follow
