Main Page
Ready to redesign civilization?
OSE Apprenticeship - starts Sep 1, 2025.
Forget about college or tech school. We are offering a radical alternative - a transformative 4 year program that will equip you with the diverse skills to re-imagine and rebuild our world.
If you want to be part of the first 24 person cohort - Apply today.. See more info on our website.

|
"Openly licensing allows others to replicate, reuse, adapt, improve, adopt, bring to scale, write about, talk about, remix, translate, digitize, redistribute and build upon what we have done." - Shuttleworth Foundation |
Please join us by becoming a True Fan today.
| |
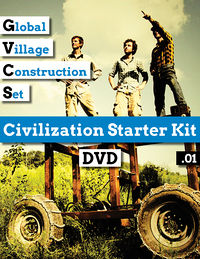
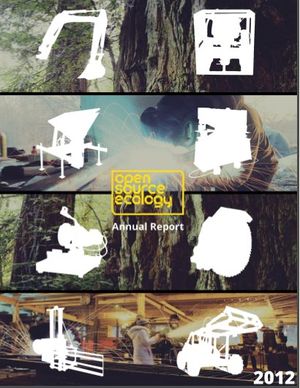
Open Source Ecology is accelerating the growth of the next economy - the Open Source Economy - an economy that optimizes both production and distribution - while promoting environmental regeneration and social justice. We are building the Global Village Construction Set. This is a high-performance, modular, do-it-yourself, low-cost platform - that allows for the easy fabrication of the 50 different industrial machines that it takes - to build a small, sustainable civilization with modern comforts.


