War Statistics: Difference between revisions
Jump to navigation
Jump to search
No edit summary |
No edit summary |
||
| Line 5: | Line 5: | ||
https://www.vox.com/2015/6/23/8832311/war-casualties-600-years | https://www.vox.com/2015/6/23/8832311/war-casualties-600-years | ||
The death rate remains at about 10,000 per year, same as 600 years ago. | The death rate remains at about 10,000 per year, same as 600 years ago. The graph is actually quite misleading. It makes it look like a collapse to zero up to 2000. | ||
[[File:wardeath.png|1000px]] | [[File:wardeath.png|1000px]] | ||
Revision as of 15:54, 9 May 2020
http://www.wrsc.org/attach_image/waning-war
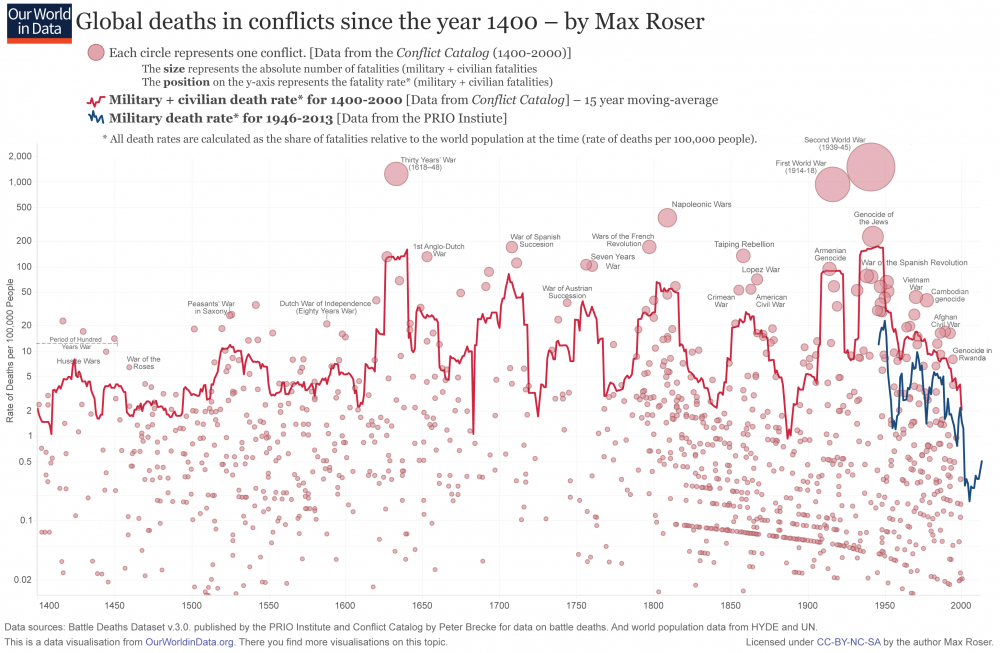
Here is a graph of war deaths over 600 years:
https://www.vox.com/2015/6/23/8832311/war-casualties-600-years
The death rate remains at about 10,000 per year, same as 600 years ago. The graph is actually quite misleading. It makes it look like a collapse to zero up to 2000.
