Per Capita Income: Difference between revisions
Jump to navigation
Jump to search
No edit summary |
|||
| Line 4: | Line 4: | ||
=American Pie Chart= | =American Pie Chart= | ||
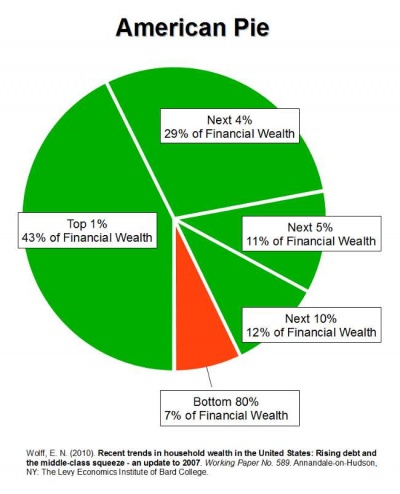
Top 1% have 43% of the wealth, and bottom 80% have 7% of the wealth in 2010. Gee, is there something wrong with this picture? | Top 1% in the USA have 43% of the wealth, and bottom 80% have 7% of the wealth in 2010. Gee, is there something wrong with this picture? | ||
[[File:americanpie.jpg|400px]] | [[File:americanpie.jpg|400px]] | ||
Revision as of 18:51, 1 July 2020
Definitions
- It includes every man, woman, and child. [1]
- Purportedly $64k in the USA [2]. This is highly misleading, as this is skewed significantly towards the upper range, as $64k for every man, woman, and child would mean everyone is living like a king
American Pie Chart
Top 1% in the USA have 43% of the wealth, and bottom 80% have 7% of the wealth in 2010. Gee, is there something wrong with this picture?
