Surveying 101
Jump to navigation
Jump to search
Surveying at Factor e Farm


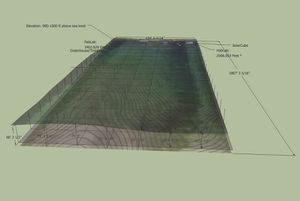
Elevations can be found by having the lowest point of the 3D Google Earth image meet with the 2D grid. Lines were then drawn vertically between the two, from each corner of the grid to the face of the Google Earth image. Dimensions can be found for each point of elevation from the lowest point of the property. From this information we can calculate the slope of each grid square.
Tools
- Contractor's site level - shoots vertical intervals - drop in stairstep. Vertical intervals are equal unless there is huge variation in slope. Contractor's level is by Berger at Home Depot.
- Laser level - online - quickest is Forestry Supply has good options. Robust. No hassle. Self-leveling laser - where you don't have to do a bubble to level. Must have 360 deg compass on it. Laser shoots 360 degrees. Shoots lo less than 1000 feet in shooting length. TopCon brand.
- Stick - Forestry Supply - 16' stick. Reads in 10ths of inch. Read the back of it, so distance from ground rather than absolute.
- Weedwhacker + chainsaw. Offset 10' from trees if trees are in the way
- Always go in one direction
- Carry a scale map of the property with you
Procedure for Contour Survey
Summary: Shoot vertical intervals first (to help you find slope). Set up horizontal intervals (following contours, creates aspect).
- Find the steepest slope in your survey area
- Mark a 2' drop standard: use the rotating laser level and flags, mark 2' intervals (decreases in elevation) down the slope
- If the slope is too steep for a 2' drop standard, may need to be 3' or 4' at high slopes (for example, on a 10% slope)
- Marking contours: From your original line, follow contours (lines level with your starting point) to each side. Mark contours with a flag every 20'
- Objective: create 25' terraces. 25' is the guiding criteria, but if it's very steep terrain the terraces might have to be as narrow as 10'
- Result: smooth arcs of 100' marked by flags, distinguishing terraces with the narrowest point of the terrace on the steepest slope
Mapping Procedure
- Making Grid With a Transit
- Objective: map a 100' grid of the site
- Number/label squares on grid for reference
- For each square you will be able to tell slope, aspect, and decide how you want to use that square (distinguish zoning)
- Label points of interest with GPS coordinates so the map can be referenced from the field
- For ground truthing, compare the written topography to the actual site.
- Find the site of worst erosion. In theory, this is the place where the water flows fastest, and has the largest effect on topography in that region.
- Find the slope and contours nearby.
- This model is useful in determining drainage patterns from a bird's eye topography. File:Model of Land forms fnl.jpg
- If the ground is true to what you have on your written map, then everything else will at least as accurate as the site of worst erosion. If there is a drastic difference, begin mapping the slope and contours and working your way out until your map begins to reflect what is presently being surveyed.
- Using the map
- GPS Status is what we're using to find the GPS coordinates in the field.
- Find points of interest (where you want a dam located, for example) in the field by matching the GPS coordinates (from map to smartphone)
Mapping Resources
- ArcGIS (Windows)
- Google Earth
- Sketchup
- GPS Status for smartphone
For the Site Map we used ArcGIS to get the topographical layer, and added the Google Earth imaging on top of that in Sketchup. The Google Earth layer is three dimensional, the Arc GIS layer is flat, and there is a grid layer in between depicting 100' x 100' squares. To view all layers at once, select "View>Face Style>X Ray."
Design at FeF
Design: 5% slope not good for animals, west face not good.
Initial thoughts:
West strip
- more water, shade
- less erosion
- more established creeks
- proposed use: homesteads, collective gardens, ponds, water storage
East strip from S to N end
- Workshops
- large-scale storage (pole barns, tractor garages)
- greenhouses
- orchard/food forest (swales, trees, vines, edible groundcover)
- on contours, stake branches in the ground to mark contour, cut weeds down and rake them into windrows resting on the stakes
- Ponds where there is good catchment (directly NW of orchard looks practical, as well as just N of the old workshop)
- pasture (organic shapes with edible fence following swales on contour)
- grazeland rotated by species, with cover crop and grain rotated seasonally
- rain catchment on animal shelters
- some shade trees planted
- water storage at top of slope, gravity-fed water troughs for animals
Native Trees
- remove ones with less utility, to be turned into biochar, lumber
- remove deadwood, leaving some logs to be inoculated with mushrooms
- Forested center space:
- Pond at north end, continuing into creek with ponds coming down the slope
- Pigs fenced in with pallets, left to forage and free range, fed the byproducts of civilization (whey, food wastes, fallen nut crop)
- Keepers: mulberry, elder, walnut, oak
Resources
- Surveying Fundamentals and Practices - J. Nathansan et al.
- Dan Schellenberg;
- Site Survey
- A Video by the YouTube Channel "Practical Engineering" Titled "How does land surveying work?" (General overview + outlines system using string/flags/surveying standard pole, etc)
Links
- GIS_Databases
- Land Survey Database
- Plat Maps
- RTK GPS
- How to Read Plat Maps
- How to Find Corner Pins
- Accuracy is 1/100 inch nowadays, was 0.7' 100 years ago [1]