CellConcentrationTurbidimeter
Cell Concentration Turbidimeter
This sensor is used in the OSE Fermentor, for example in Polylactic Acid Production. It provides continuous on-line measurement of cell concentration in the fermentor broth.
Cell Counting Background
During fermentation, real-time monitoring of the cell population is very helpful in process control.
Direct Measurements
The most important parameter of the process is most commonly live-cell concentration; however this is difficult to measure directly. Possible methods are
- Colony counting: serial dilutions are plated out onto agar and incubated. This is the most widely used reference method but is tedious and cannot provide real-time feedback. Best used as a calibration technique for an alternative real-time method.
- Metabolic heat generation: http://www.sciencedirect.com/science/article/pii/S004060311200278X#bib0105
Indirect Measurements
In practice, direct measurements are not used for process control; instead, indirect measurements are used to estimate live-cell concentration. Some alternatives:
- Total Cell Count
- Coulter counter: single-particle electroconductivity analyzer.
- Microscopic: cells are collected on a membrane filter and counted under an optical or electron microscope. This cannot provide real-time feedback, but can be used as a calibration technique for other methods.
A limitation of cell-counting methods is that they do not discriminate living from dead cells.
- Turbidimetry
The simplest real-time indirect measurement method responds to the cloudiness ("turbidity") of the fermentor broth. When a light beam passes through a broth sample, the cells scatter light out of the beam. In the general case, turbidity can be measured either by looking at the side scatter (nephelometry -- especially useful for very-low-turbidity fluids) or looking at the diminution in main beam intensity (optical density, OD). It is this latter technique that is most accepted in microbiology for estimating cell concentration.
Limitations of turbidimetric methods are that the measured optical signal is dependent on many factors beyond cell count:
- cell species
- cell size distribution
- wavelength spectrum of illumination
- illumination and collection angles of the beam
- suspended solids other than cells
- dissolved materials in the fluid
- gas bubbles
For these reasons the correlation between cell count and optical density must be established by a calibration that is specific not only to the particular instrument in use but also to the cultured species, the growth medium, and operational conditions.
Once a calibration curve is established, a turbidimetric sensor provides consistent information for real-time process monitoring and control, provided the operational conditions correspond to the calibration conditions. This method is widely used in practice. Use of a laboratory spectrophotometer with a 1-cm-path-length cuvette and 600nm illumination wavelength has become a de facto standard. Commonly the optical density (which is the base-10 logarithm of the ratio between illumination intensity and transmitted intensity) is considered proportional to cell concentration over a range of about 0.1 to 0.8 OD.
The calibration constant is usually given as (cells/mL)/(1.0 OD) (even though 1.0 OD is beyond the linear range). As noted above, this value is highly dependent on operational conditions; reported calibration constants for E. coli vary from 1e8 to 1e10.
Sensor Requirements
For the OSE polylactic acid fermentor, the sensor faces the following conditions and requirements:
- Organism: Bacillus coagulans
- Concentration range: 1e5 to 1e8 cells/mL
- Sensor interface: Arduino, shared with open source bioreactor controller.
- Sensor system cost: less than $100 in parts, including electronics and fluid handling components
Sensor Design
The optical design of a typical laboratory spectrophotometer must meet many challenging requirements which are outside the scope of turbidity measurement; it is therefore overcomplex for a dedicated process sensor. The key optical requirements are
- repeatable narrowband illumination spectrum
- repeatable illumination/collection angular geometry
- ability to compare the sample to a clean "blank"
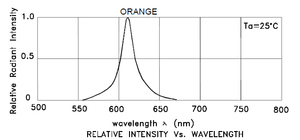
The OSE sensor uses a collimated LED light source with a spectral bandwidth approx. 20nm FWHM centered near 610nm, such as Kingbright WP7113SEC/J4 (available from DigiKey). At the opposite side of a flow cell, a collimated silicon PIN photodiode such as Osram SFH213 (also available from DigiKey) receives the light beam. The flow cell is constructed of two parallel glass windows sealed to spacers with silicone adhesive.
A syringe pump, valve, and clean-water source support a cyclical sampling operation in which broth is drawn from the reactor into the flow cell then returned to the reactor followed by a clean-water purge. The photodiode measurement on the sample is compared to the measurement after clean-water purge (the "blank") to obtain an OD measurement.
Research and Development
http://starch.dk/isi/papers/JMM%2010%20EB.pdf

