Category:Munin Graphs
Jump to navigation
Jump to search
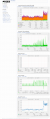
Add this category to all uploads of screenshots taken of Munin Graphs. These graphs may be useful in debugging the OSE_Server or for provisioning when calculating requirements of expected future hardware needs.
It would be wise to dump snapshots of such graphs to the wiki every year or so for the historical record.
Note that these images compress & view best as gif images max ~800k in size. This can be done in batch on the cli (after creating a backup of the original files!), for example:
# convert all PNGs to GIFs
for file in $(ls *.png); do name=${file%.*}; echo $name; convert $file "${name}.gif"; rm $file; done

# resize each image only if needed
find . -maxdepth 1 -iname '*.gif' -size +800k -exec convert '{}' -resize '2700000@>' {} \;
See Also
Media in category "Munin Graphs"
The following 41 files are in this category, out of 41 total.
 Munin cpu-day 20240730.gif 497 × 376; 19 KB
 Munin cpu-year 20240730.gif 497 × 376; 16 KB
 Munin df-year 20240730.gif 497 × 316; 11 KB
 Munin disk year.20190907.gif 776 × 6,944; 766 KB
 Munin diskstats throughput-day 20240731.gif 497 × 328; 18 KB
 Munin diskstats throughput-year 20240731.gif 497 × 328; 32 KB
 Munin diskstats-page-day 20240731.gif 793 × 7,127; 796 KB
 Munin diskstats-page-year 20240731.gif 548 × 4,926; 783 KB
 Munin load-day 20240730.gif 497 × 280; 19 KB
 Munin load-year 20240730.gif 497 × 280; 14 KB
 Munin memory-day 20240730.gif 497 × 436; 24 KB
 Munin memory-year 20240730.gif 497 × 436; 31 KB
 Munin monthlyGraphAfterWikiMigration network.png 781 × 1,855; 189 KB
 Munin monthlyGraphAfterWikiMigration system.png 781 × 4,377; 448 KB
 Munin monthlyGraphAfterWikiMigration varnish.png 781 × 3,949; 372 KB
 Munin morningAfterWikiMigration1.gif 1,545 × 6,520; 565 KB
 Munin morningAfterWikiMigration2.gif 1,545 × 7,733; 711 KB
 Munin multips memory-week 20240730.gif 497 × 532; 25 KB
 Munin multips memory-year 20240730.gif 497 × 532; 28 KB
 Munin multips-memory day.20200427.gif 497 × 532; 26 KB
 Munin multips-memory month.20200427.gif 497 × 532; 28 KB
 Munin multips-memory week.20200427.gif 497 × 532; 29 KB
 Munin multips-memory year.20200427.gif 497 × 532; 25 KB
 Munin munin screenshot 20240730.gif 600 × 7,725; 939 KB
 Munin network year.20190907.gif 776 × 1,857; 183 KB
 Munin nginx month.20200427.gif 497 × 316; 20 KB
 Munin nginx week.20200427.gif 497 × 316; 24 KB
 Munin nginx wiki opensourceecology org request-day 20240730.gif 497 × 280; 17 KB
 Munin nginx wiki opensourceecology org request-month 20240730.gif 497 × 280; 24 KB
 Munin nginx wiki opensourceecology org request-week 20240730.gif 497 × 280; 24 KB
 Munin nginx wiki opensourceecology org request-year 20240730.gif 497 × 280; 12 KB
 Munin nginx year.20200427.gif 497 × 316; 16 KB
 Munin overview year.20190907.gif 500 × 5,395; 954 KB
 Munin postfix year.20190907.gif 776 × 886; 83 KB
 Munin process year.20190907.gif 776 × 1,857; 157 KB
 Munin system year.20190907.gif 776 × 4,381; 461 KB
 Munin varnish day.20190907.png 784 × 2,446; 546 KB
 Munin varnish month.20190907.png 784 × 2,446; 543 KB
 Munin varnish week.20190907.png 784 × 2,446; 536 KB
 Munin varnish year.20190907.png 784 × 2,446; 496 KB
 Munin varnish4 year.20190907.gif 776 × 3,953; 356 KB


